
Jump to: Experimental Design | Instrumental Analysis | Sample Preparation | Data Analysis
In order to have the most successful metabolomics experiment possible we recommend the following guidelines.
Experimental Design:
Without a good experimental design metabolomics data can have a large amount of bias and can be very misleading. There should be a comprehensive amount of samples in the experiment. We recommend at least 5 different samples, but the more the better. For an example: if you are looking at the relationship of different plant species in the same genus, it makes sense to have a sample set of 5 or more different plant species. We recommend at least 3 biological replicates (3 separate plants of the sample species) but more certainly does not hurt. In addition to biological replicates, we recommend analytical replicates (triplicate injections of each sample-including biological replicates). This is to showcase the instrument variance and establish actual features from interference.
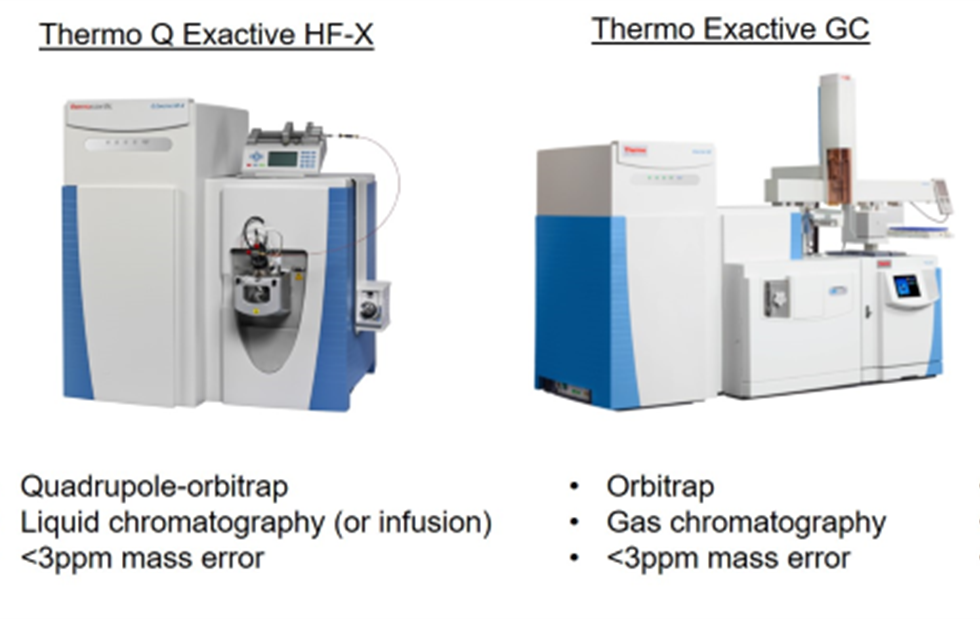
Instrumental Analysis:
Again, we recommend triplicate injections of every sample (including biological replicates) spaced out over the analysis time-not back to back injections. This will allow an idea of how the system is changing over the length of the analysis. A quality control with a set of known compounds should be included across the analysis to monitor the instrument consistency. Blanks should also be included throughout the analysis.
Sample Preparation:
Sample should be prepared based on mass so that every sample has the same ending concentration. This will allow a more accurate comparison of abundance of metabolites. When performing an LC-MS analysis, samples should be prepared with optima grade solvents. We would recommend testing the instrument with a variety of concentrations of one of the biological samples (low to high concentrations) to find the ideal concentration for analysis. For complex mixtures, such as plant extractions, we recommend a concentration of 100 µg/mL for most systems. Sample preparation is the most important part of a metabolomics experiment, because any variability introduced will affect the analysis. Be sure to be thorough and treat all samples the exact same in the process.
Data Analysis:
We employ MzMine for all mass spectrometry data processing (peak lists), Excel for all post-processing filtering, and Sirius for all multivariate statistical analysis. We recommend reading the MzMine manual for individual instructions on how to process mass spectrometry data. It is best to view the raw data in the manufacturer software before processing the data to give an idea of what parameters to use. We also recommend performing relative standard deviation (RSD) filtering in Excel using the analytical triplicates from the analysis. Normally we set a threshold of 25% RSD for triplicate injections of the same exact sample (most new instruments will perform at an RSD% of <5). You can replace the features with high RSD values with a peak area of “0” so they no longer impact the data set. This will help remove common interference from the system. A typical statistical analysis used in metabolomics is Principal Component Analysis (PCA). If looking at a broad set of mostly unknown compounds, we recommend using this statistical approach. There are other forms of statistical analysis (supervised statistics) that can be used with more knowledge of the sample set.